

Most cold-calling dashboards track 11 numbers. Three of them predict your contract volume. The other 8 are noise.
If you can’t recite the three from memory, your dashboard is decoration.
The three numbers that predict contracts.
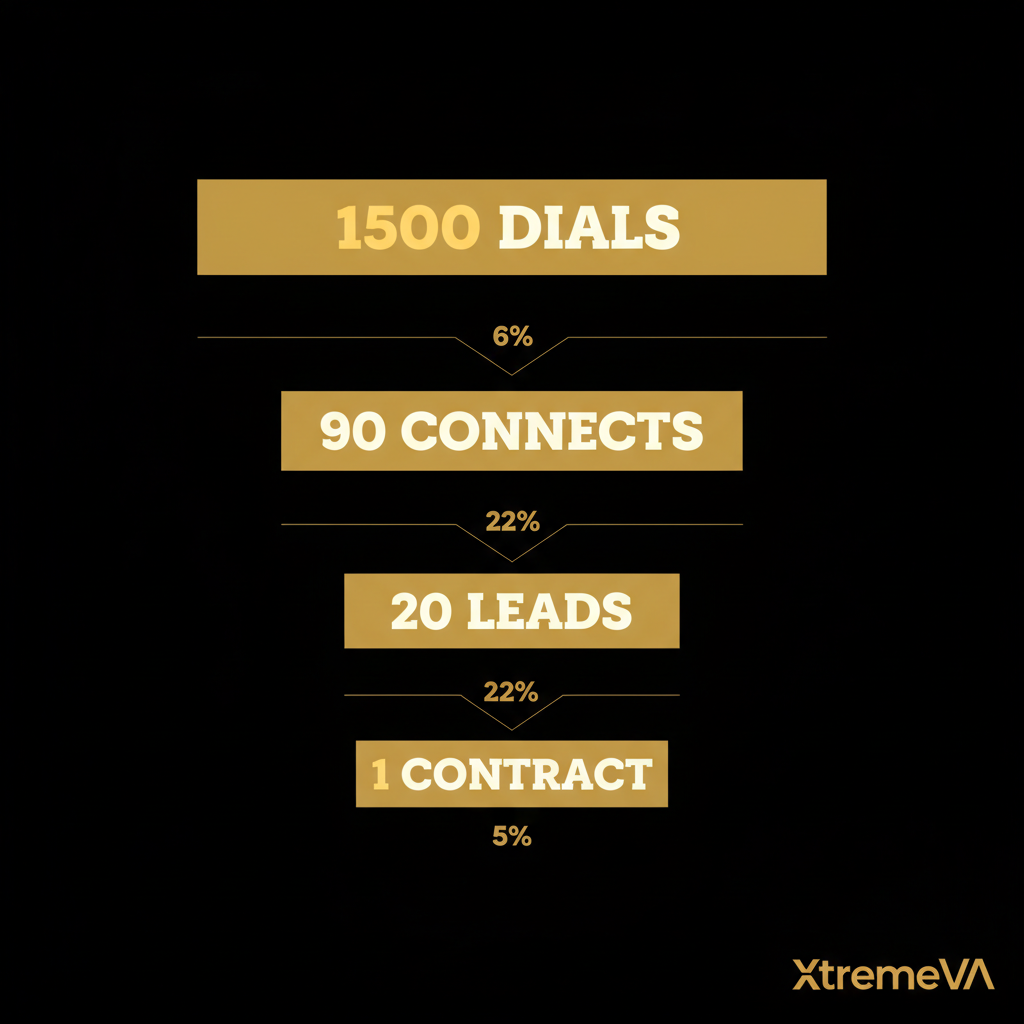
- Connect rate — connects per dial. Healthy range: 4-7% on a fresh skip-traced list. Below 4%, the list is decaying or the dialer is misconfigured. Above 8% is suspicious — usually means short-call hang-ups counted as connects.
- Lead rate — qualified leads per connect. A “qualified lead” is a seller who listened >2 minutes and engaged with the offer pitch. Healthy range: 15-25%. Below 12%, the script or the caller is broken.
- Lead-to-contract conversion — contracts per qualified lead. Healthy range: 4-8%. Top 10% shops: 10-12%. Below 3%, your acquisitions process is leaking — usually missing comp pulls or no follow-up cadence.
Multiply them and you get contracts per dial. At healthy ranges (5% × 20% × 6%) that’s 0.06% — 1 contract per 1,666 dials. A cold caller running 300 dials/day at 22 working days is at 6,600 dials/month, predicting ~4 contracts. Top 10% (7% × 25% × 11%) is ~13 contracts/month per dialer.
Do this tomorrow: compute the three numbers from your last 30 days. The worst one is your fix target for this month.
Why every other KPI is downstream noise.
Operators love to track 11 things: total dials, average call duration, callbacks scheduled, voicemails left, text response rate, RVM listens, dispo blast opens, etc. These are activity metrics. None of them predict contracts in isolation.
Total dials tells you if the caller showed up. It doesn’t tell you if anyone picked up. Call duration tells you the caller talked. It doesn’t tell you if anything productive came out. Callbacks scheduled tells you the seller didn’t hang up. It doesn’t tell you they’ll close.
The three numbers above (connect rate, lead rate, conversion) are the only ones tied directly to outcomes. Track those. Track the others if you want, but don’t make decisions off them.
Do this tomorrow: on your KPI sheet, mark the three predictive numbers in green. Everything else in gray. Decisions come from the green column.
The mistake that buries the signal.
Operators average the three KPIs across the team and miss the per-VA story. One cold caller running 7% connect / 25% lead / 9% conversion can carry an entire team. The team average looks fine. The truth is one VA is the business and the others are dead weight.
Track these per VA, every week. The variance between top and bottom callers on a healthy team is 2-3x. A team where the gap is 5x has a coaching problem or a swap problem.
The second mistake is measuring monthly. The signal moves week to week. By the time you see a monthly dip, you’ve lost 3-4 weeks of contracts.
Do this tomorrow: rebuild your KPI sheet with one row per VA and the three numbers as columns. Compute weekly. Color-code each VA’s current week against their 4-week average.
The 5-step plan to install predictive KPIs this week.
- Define “qualified lead” in writing — 2+ minute engagement, offer pitch heard. One bar across the team.
- Pull last 30 days. Compute connect rate, lead rate, conversion per VA.
- Find the worst of the three. That’s the fix target for the month.
- Stop tracking the 8 noise metrics. Or track them in a separate tab.
- Friday 4pm: 15-minute review of the three per VA. If a VA is below threshold for 2 weeks running, coach. For 3 weeks, swap.
The teams that scale don’t have better dashboards. They have shorter ones, focused on the three numbers that actually predict the next contract.
Ready to staff up?
XtremeVA staffs trained real estate VAs — cold callers, acquisitions, disposition, and lead managers — for wholesalers, investors, and realtors. Monthly billing, no long contracts, replacements free.